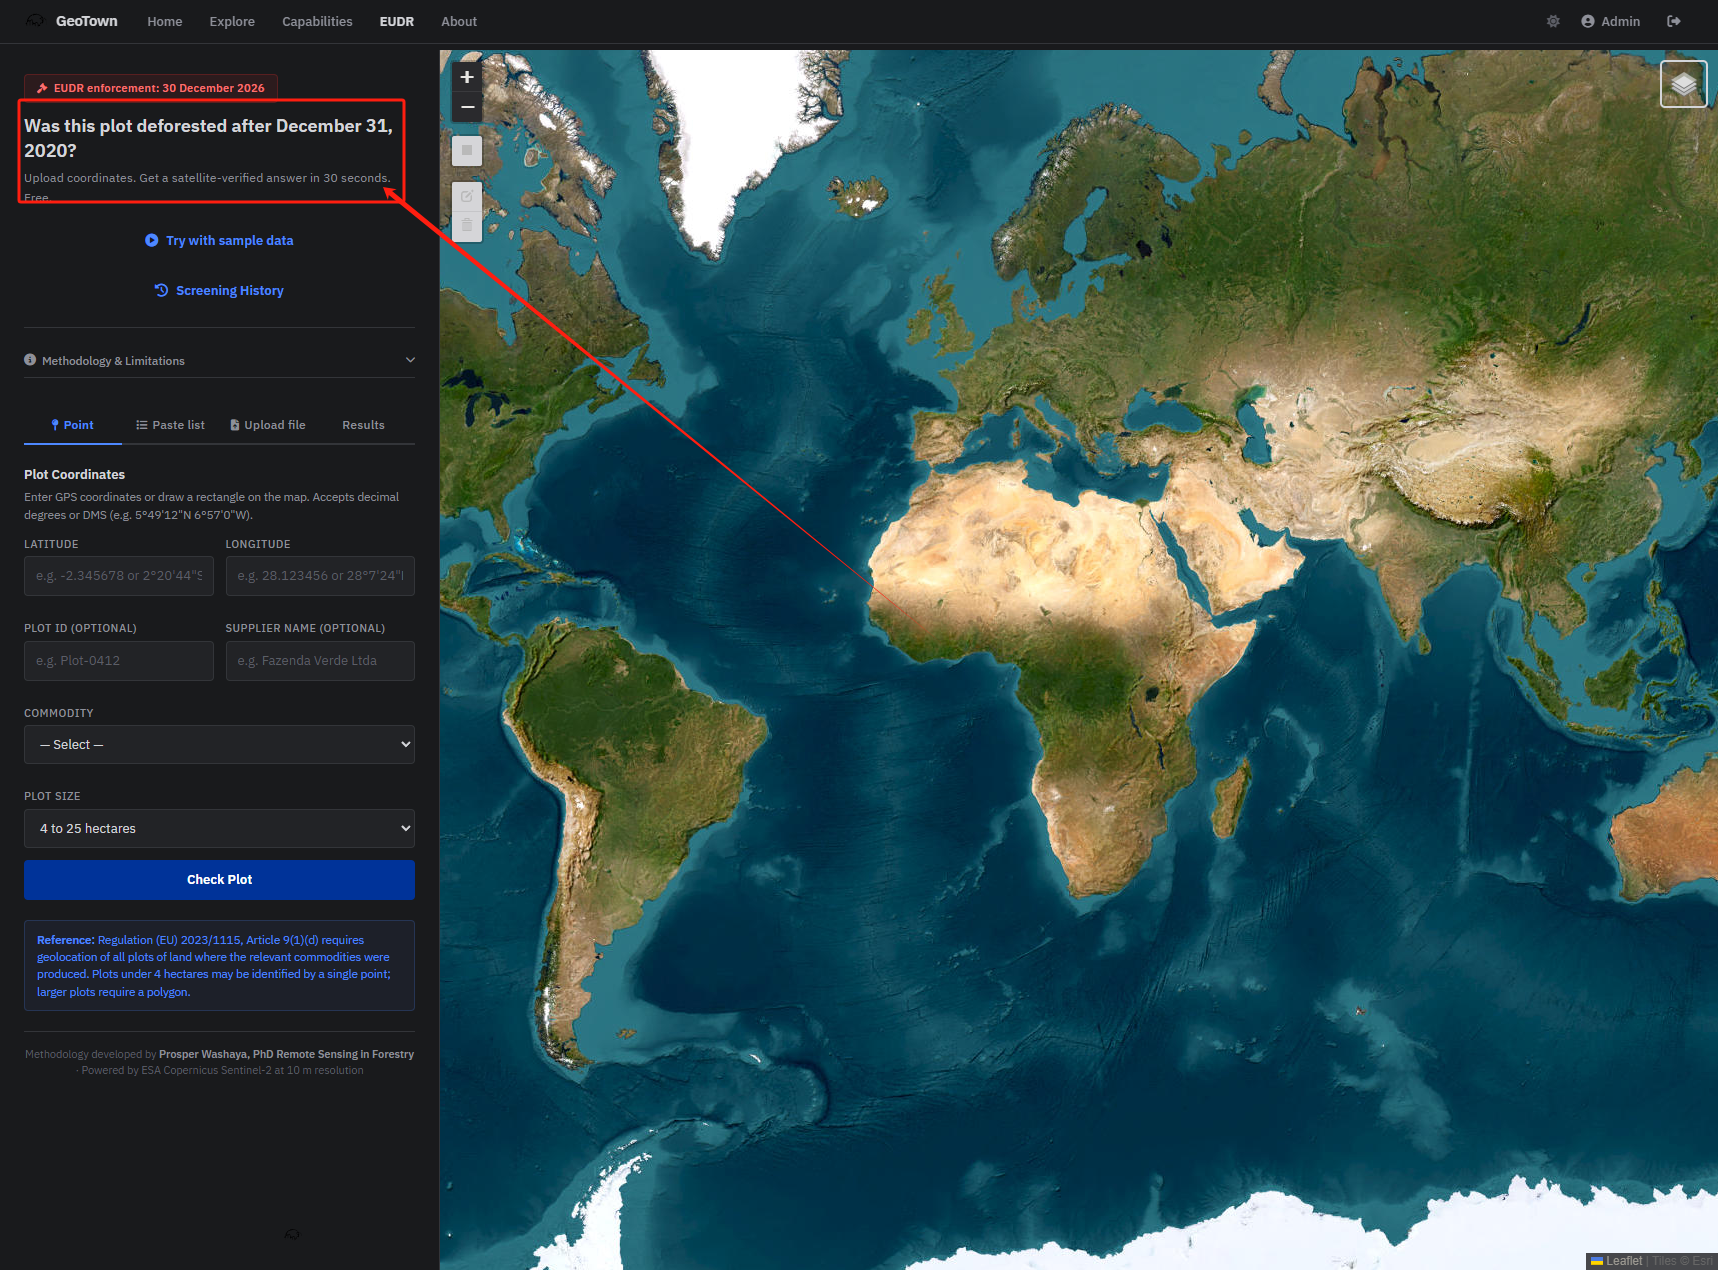
24 deforestation-free. 1 flagged for review.
That's the result of running 25 cocoa plot coordinates through GeoTown's EUDR screening tool — plots located along the border of Tai National Park in western Cote d'Ivoire, one of the highest-risk deforestation frontiers on Earth.
The whole batch took under 10 minutes. No GIS software. No remote sensing expertise. Just a CSV upload in a browser.
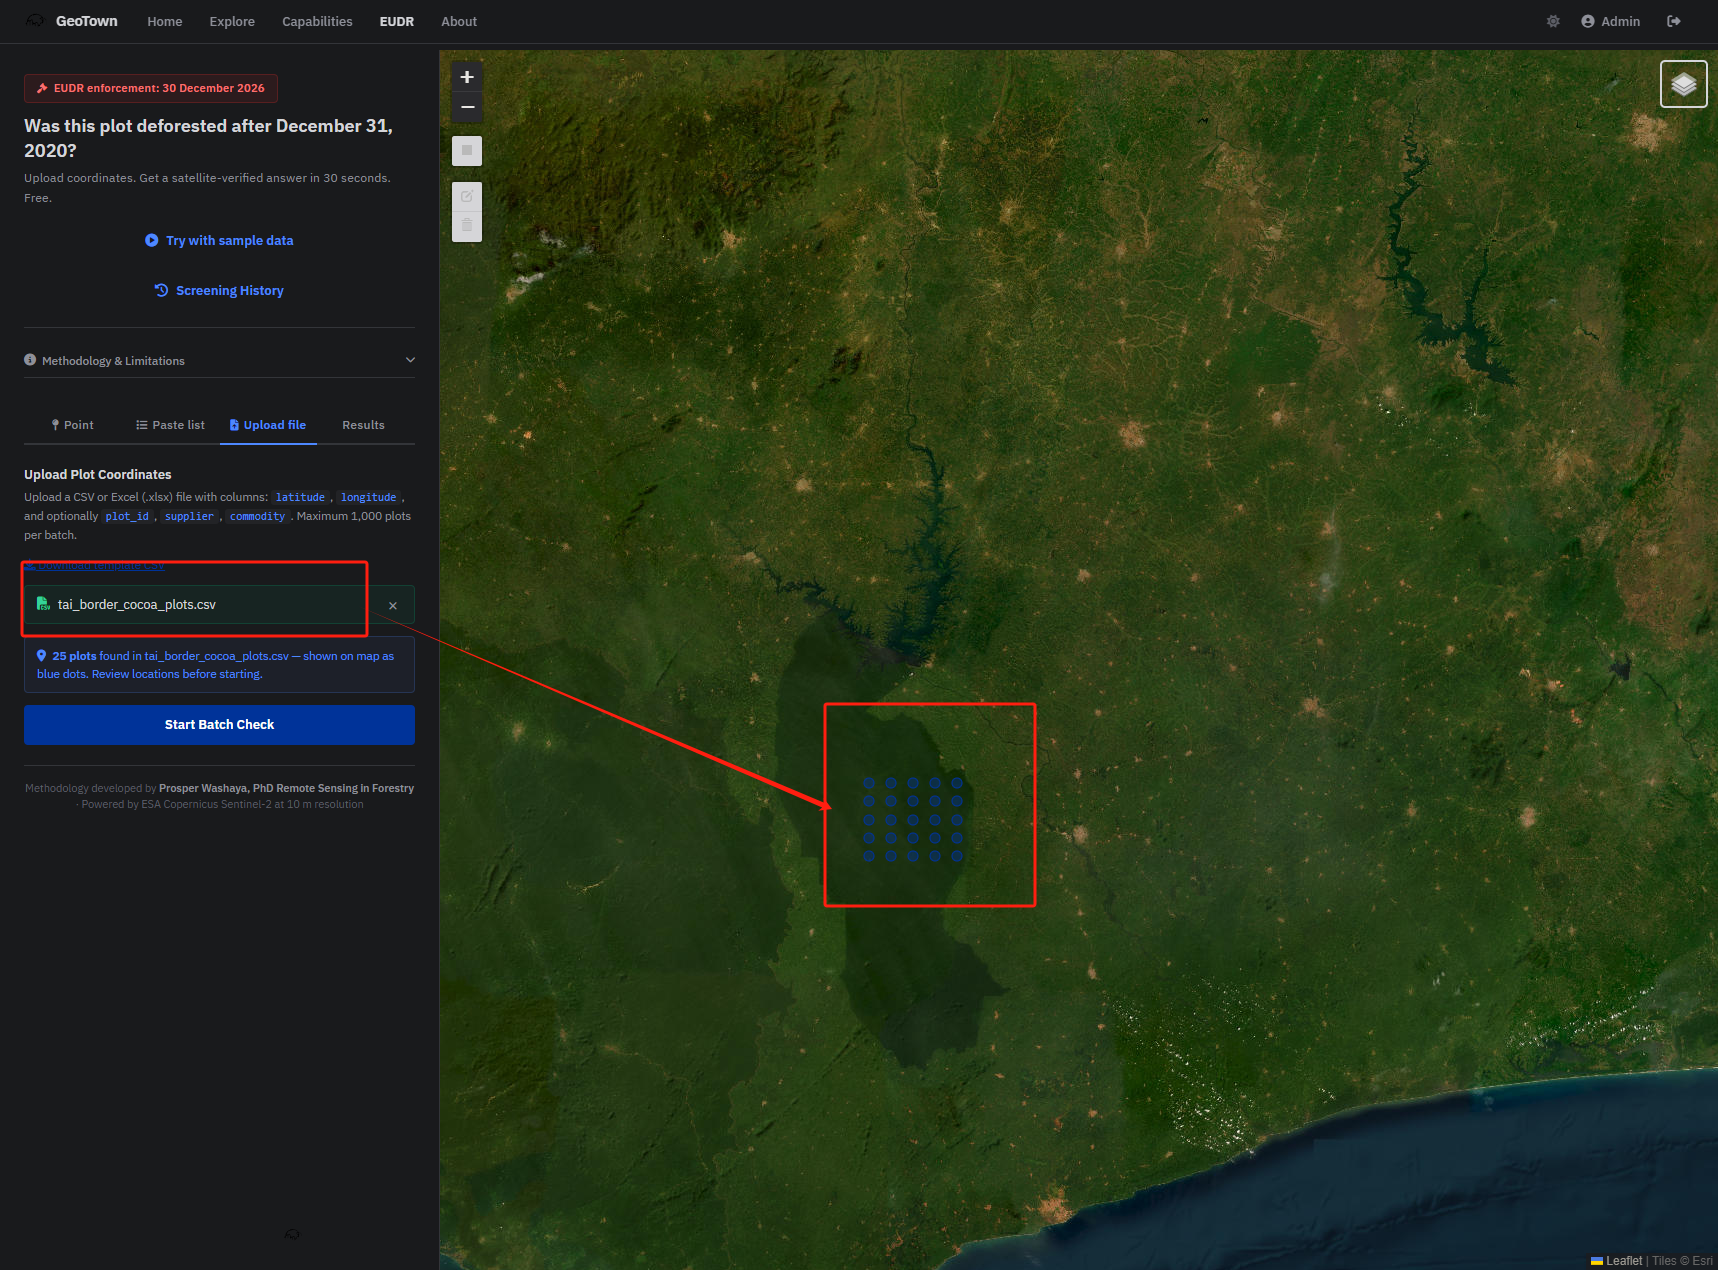 25 cocoa plots uploaded via CSV, shown as blue dots on satellite imagery along the Tai National Park border. The dark green mass to the west is the park itself — the plots sit right on the frontier where cocoa farming meets protected forest.
Why this matters right now
The EU Deforestation Regulation (EUDR) takes effect December 30, 2026 for large and medium companies. If you place cocoa, coffee, soy, palm oil, rubber, cattle, or wood products on the EU market, every kilogram needs geolocated coordinates and satellite-verifiable proof that the land it came from was not deforested after December 31, 2020.
The penalty for non-compliance: up to 4% of annual EU turnover, product confiscation, and exclusion from public procurement.
Cote d'Ivoire supplies 45% of the world's cocoa. Roughly 75% of that goes to the EU. This regulation hits the Ivorian cocoa supply chain harder than almost anywhere else on the planet.
What I actually did
I compiled 25 GPS coordinates for cocoa-growing plots along the eastern edge of Tai National Park — the region where forest encroachment for cocoa farming has been most aggressive over the past decade.
 The same 25 plots shown on a street map for geographic context. The plots sit between Tai National Park and Soubre — the largest cocoa-producing district in the world.
For each coordinate, GeoTown's EUDR tool:
- Found the closest cloud-free Sentinel-2 satellite image to December 31, 2020 (the EUDR cutoff date)
- Found the most recent cloud-free image (April 2026)
- Computed NDVI (Normalized Difference Vegetation Index) for both dates — a standard measure of vegetation density
- Compared the two values and issued a verdict
The tool covers all seven EUDR commodity categories — cocoa, coffee, soy, palm oil, rubber, cattle, and timber — and lets you select plot size to match the regulation's geolocation requirements.
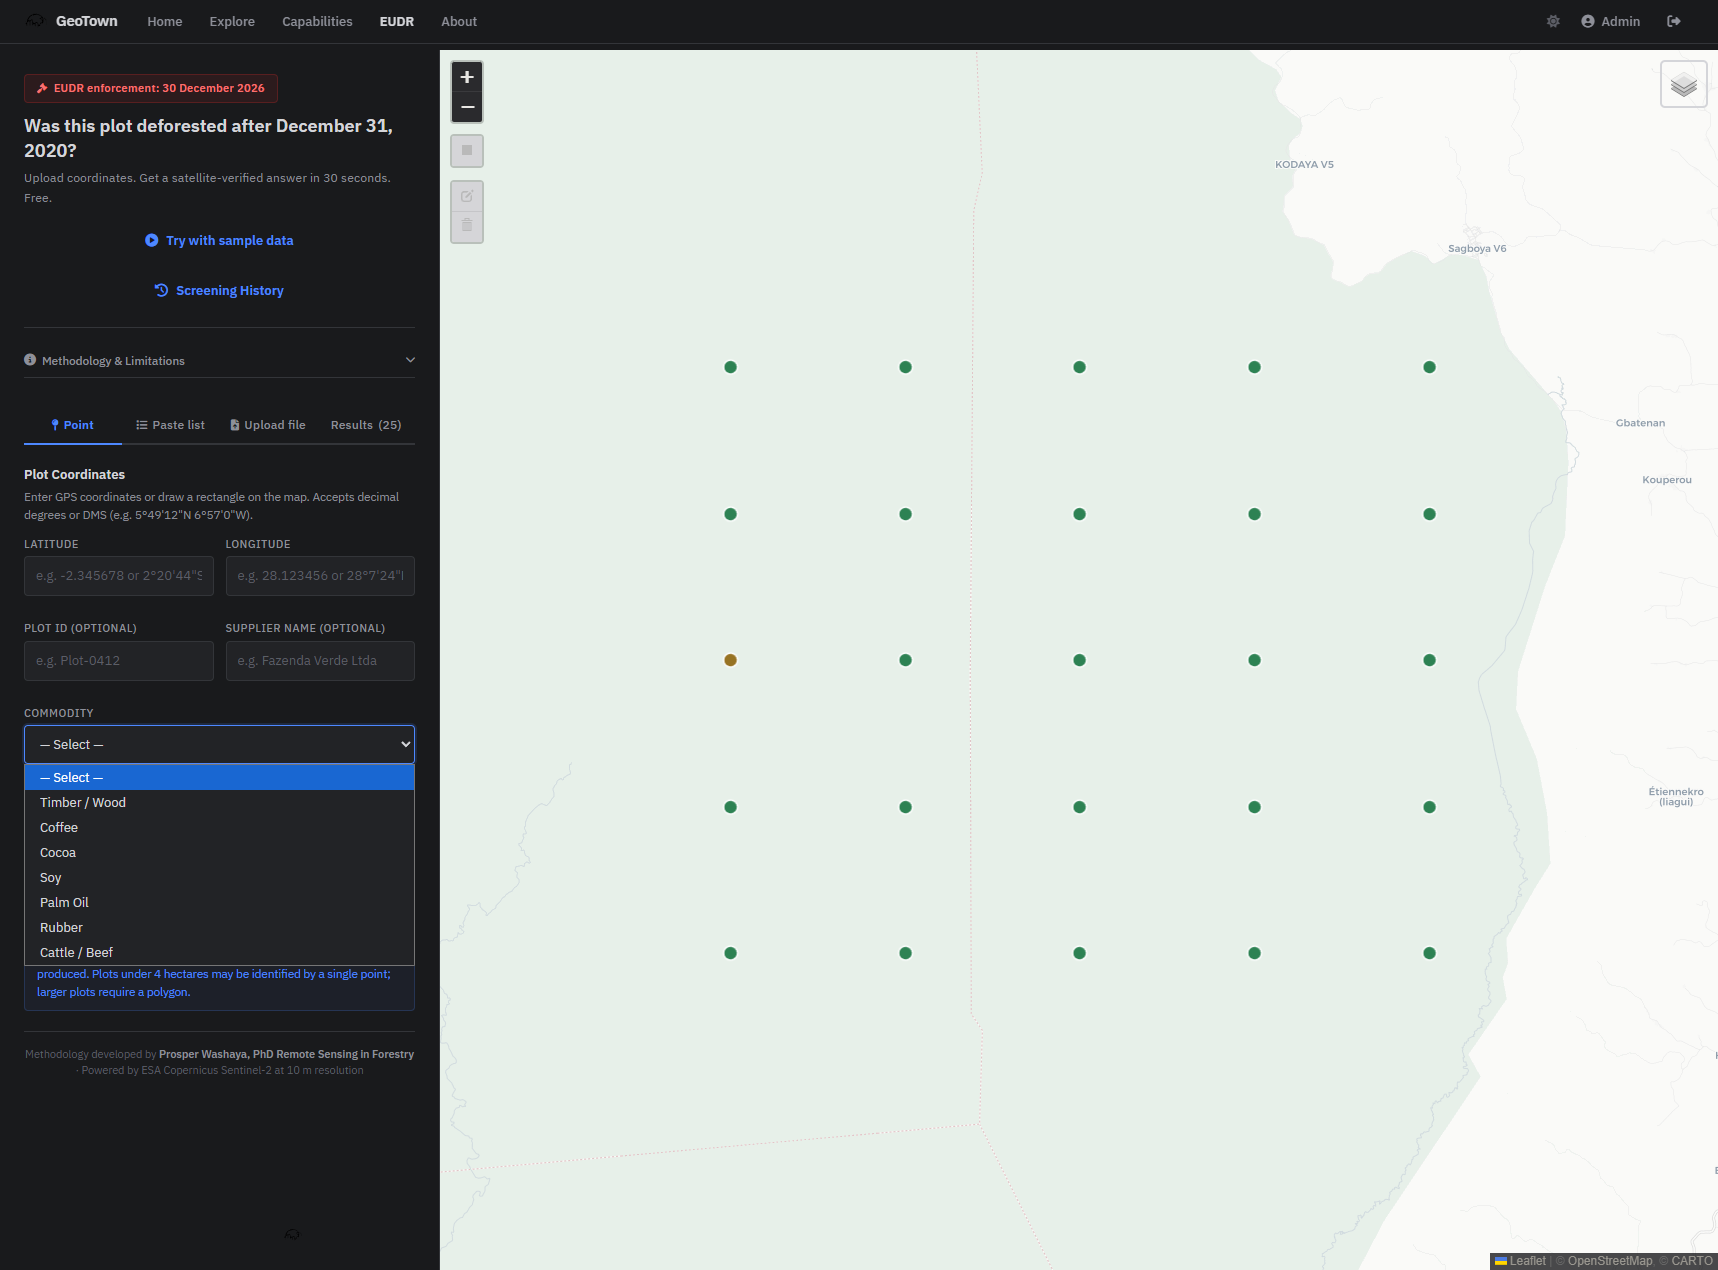 The tool supports all seven EUDR-regulated commodities and adjusts analysis area based on plot size, following EUDR Article 9 geolocation requirements.
The results
Out of 25 plots screened:
| Verdict | Count | What it means |
|---|---|---|
| Deforestation-free | 24 | Forest cover stable since December 2020 |
| Review needed | 1 | Forest cover dropped ~10% — could be seasonal variation or early-stage clearing. Needs ground verification. |
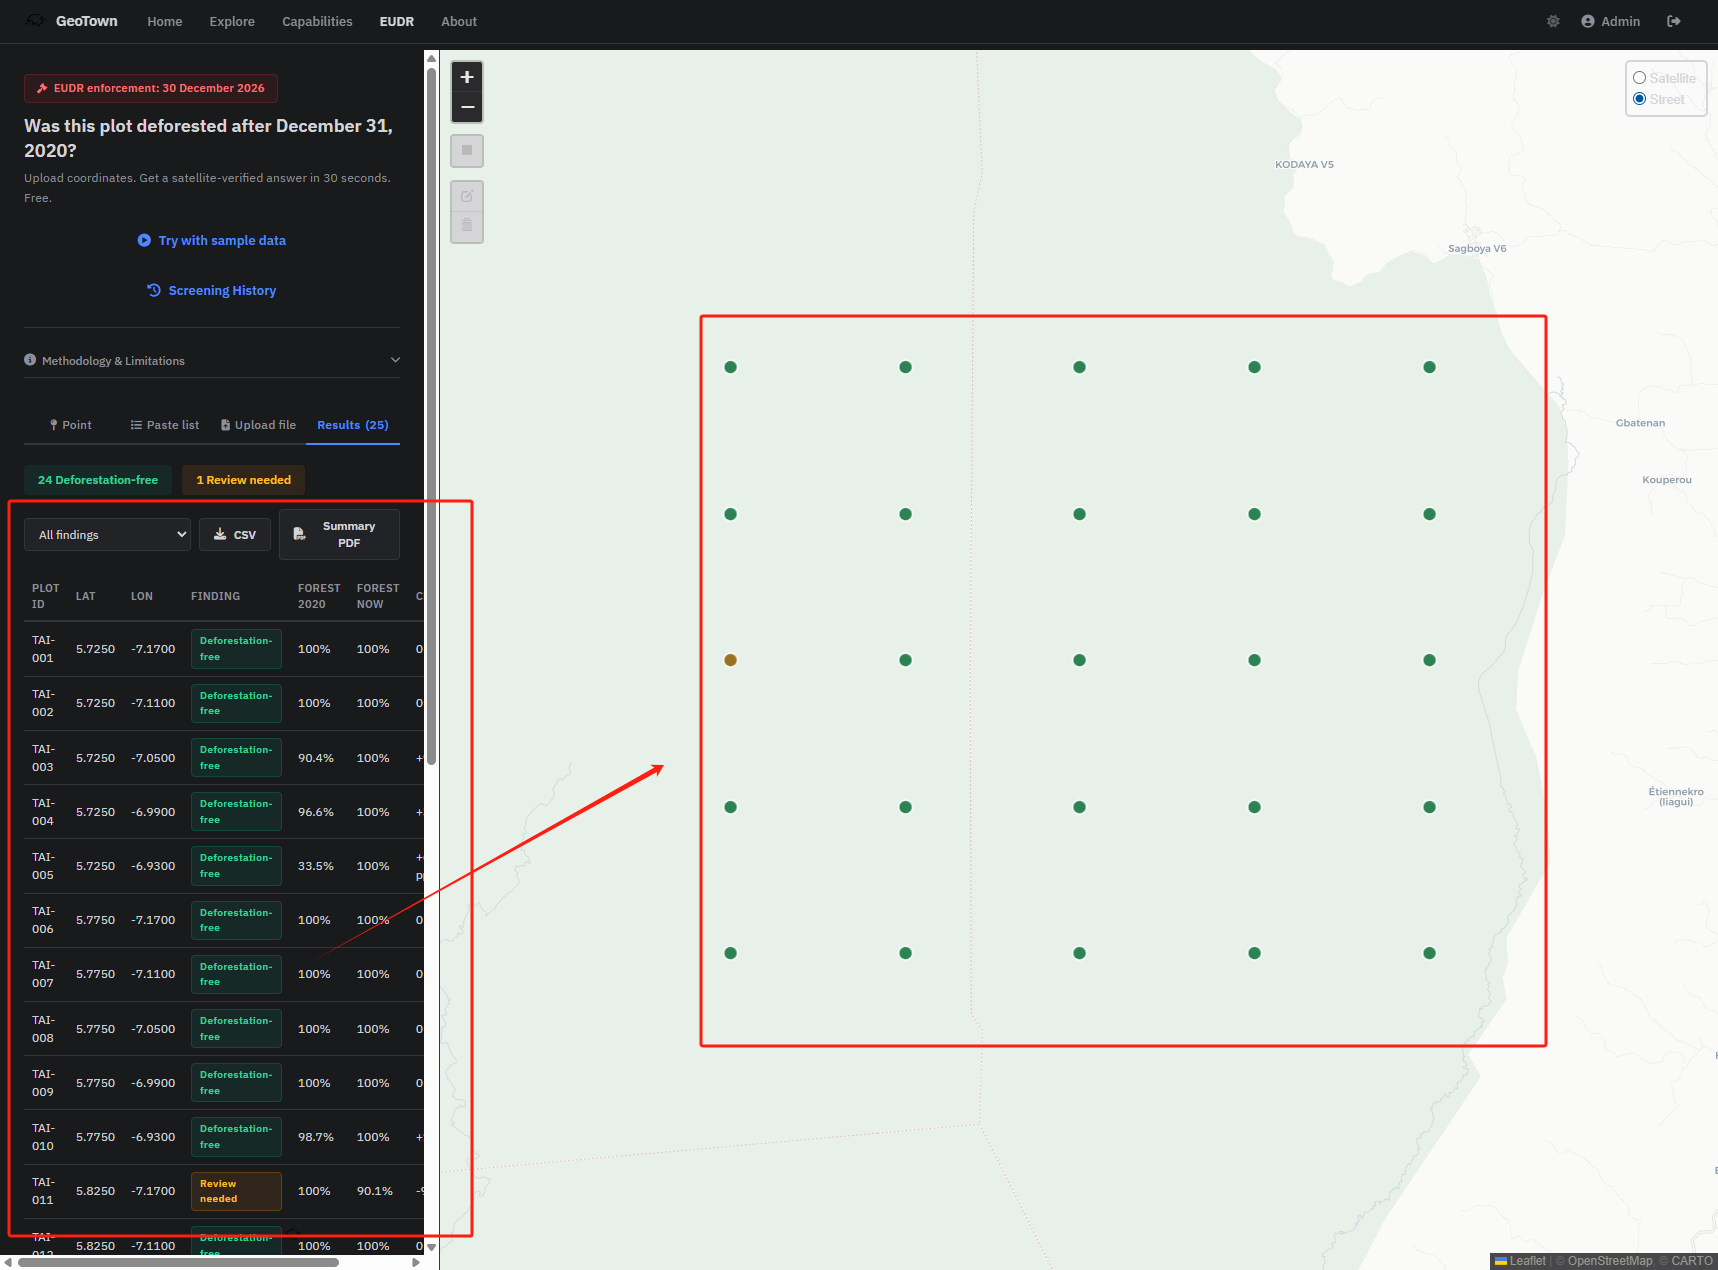
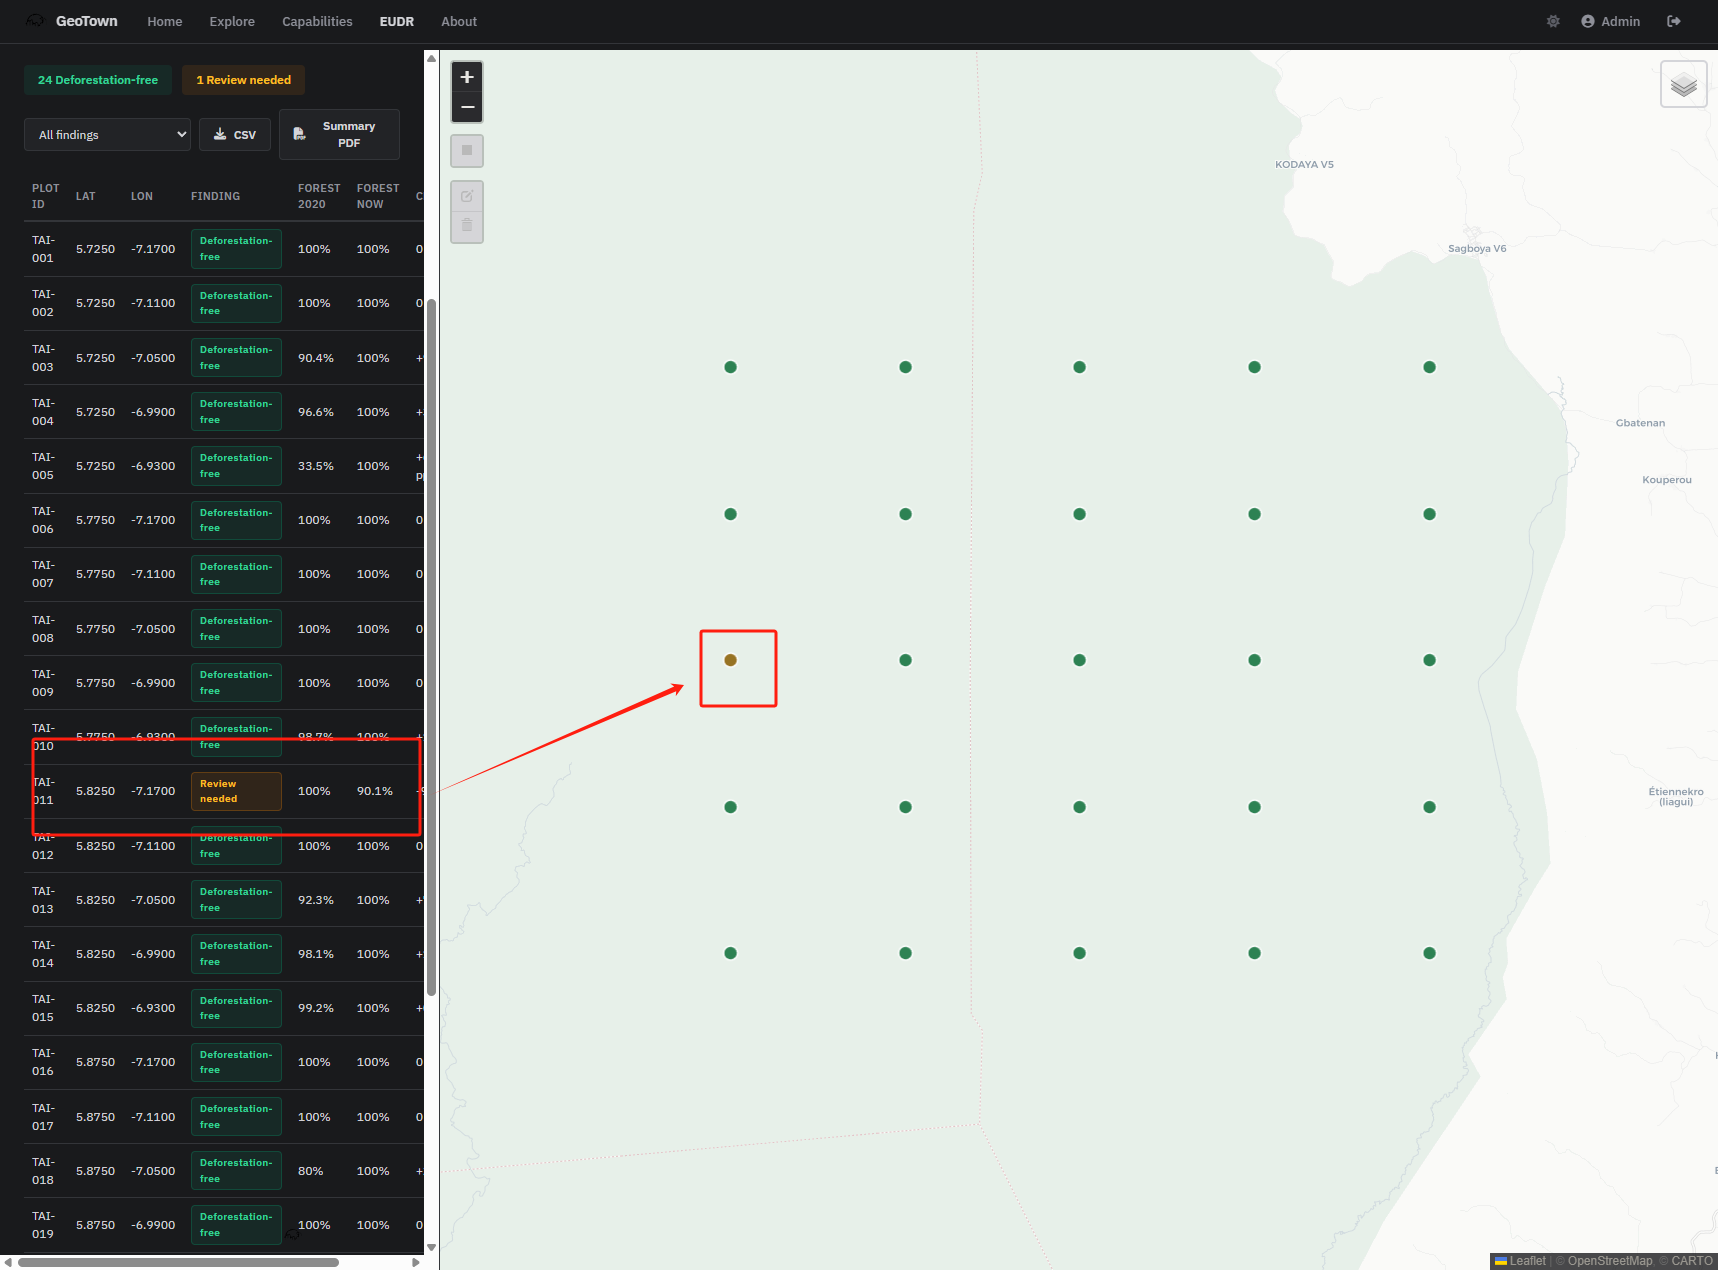
 Full results table with the map. The single yellow dot (TAI-011) is the one plot flagged for review — its forest cover dropped from 100% in 2020 to 90.1% in 2026.
96% of plots passed outright. That's actually the point — most land in most supply chains is fine. The screening is about finding the 4% that isn't, before an EU customs authority does.
The flagged plot — TAI-011 at coordinates 5.825, -7.170 — showed forest cover declining from 100% to 90.1%. That's a 9.9 percentage point drop: not catastrophic, but enough to warrant investigation. It could be selective logging, edge encroachment from adjacent farmland, or natural canopy thinning. A field visit would confirm.
 TAI-011: the only plot that didn't pass. Forest cover went from 100% (2020) to 90.1% (2026). The yellow dot on the map marks its location.
What the report looks like
Every screening — single plot or batch — generates a downloadable PDF evidence report. It includes the baseline and current satellite scene references, forest cover percentages, NDVI change maps, and true-colour satellite image comparisons.
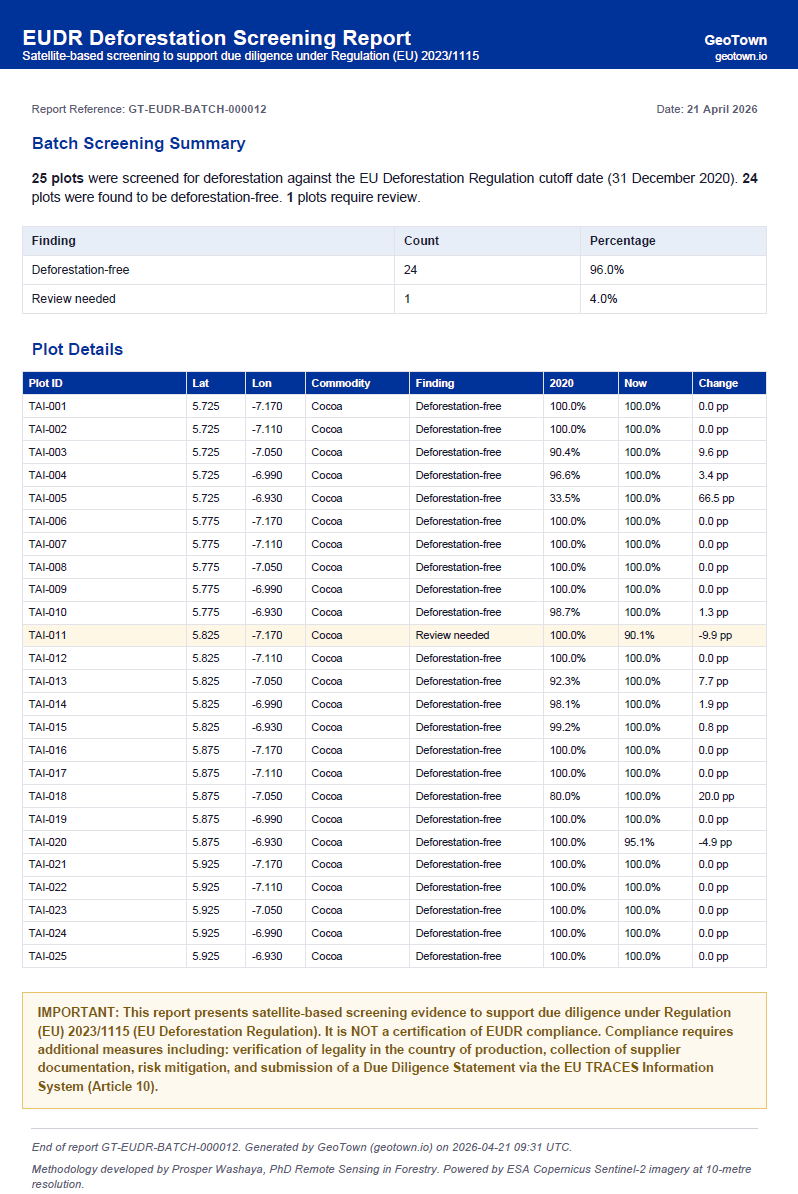 The batch PDF report: summary statistics at the top, per-plot breakdown below. Report reference numbers are auto-generated for audit trails.
For individual plots, the report goes deeper — showing a spatial NDVI change map and side-by-side satellite imagery from the baseline and current dates.
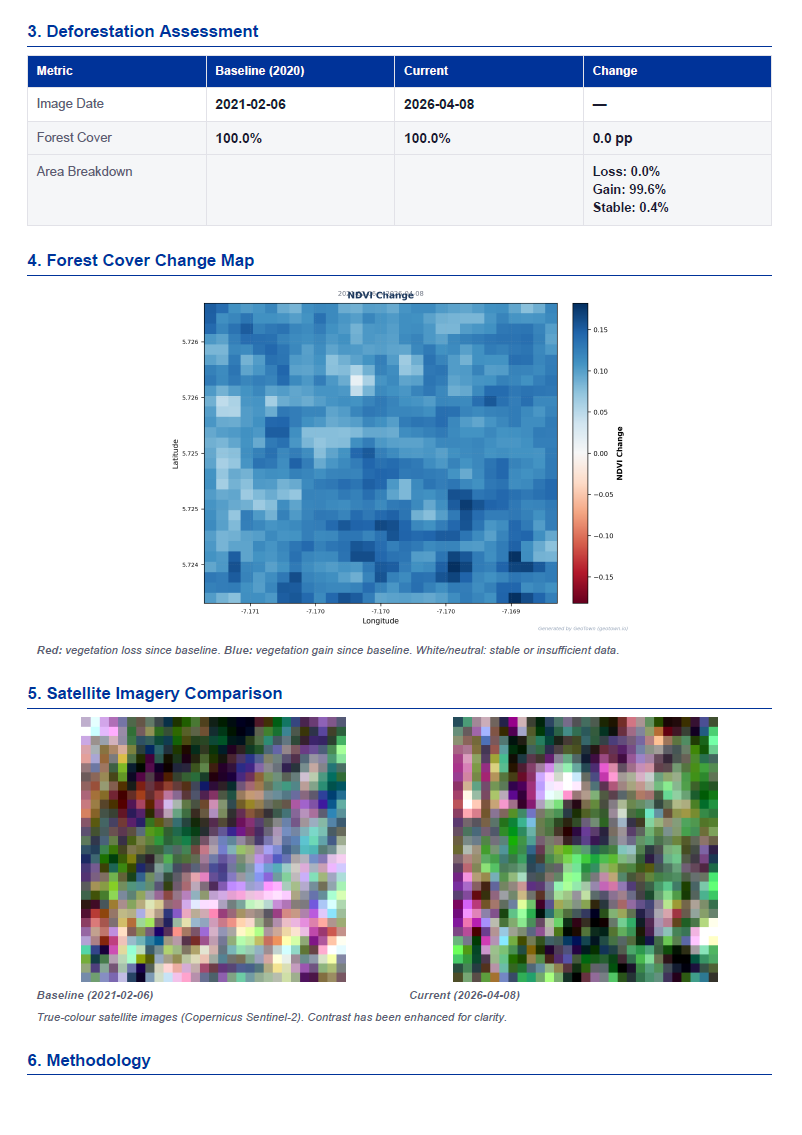 A single-plot report: NDVI change map (blue = vegetation gain, red = loss) and true-colour satellite comparison between February 2021 and April 2026.
The data is also exportable as CSV for integration with your own systems.
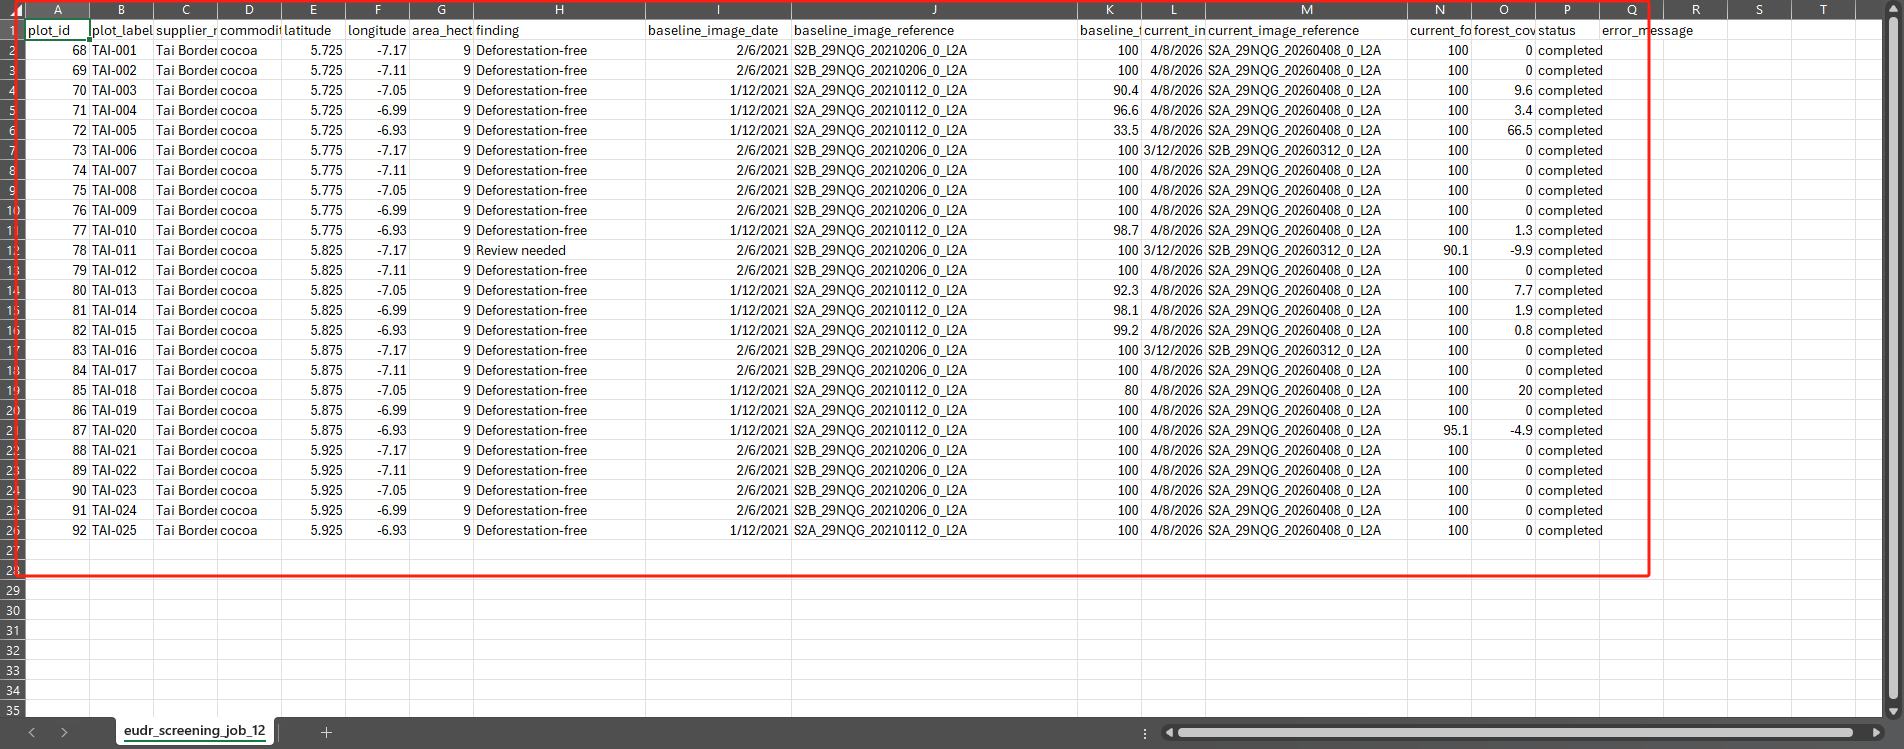 Raw CSV export with full audit data: baseline and current scene references, image dates, forest cover percentages, and change values for every plot.
The methodology — transparent by design
The tool shows exactly how it works. No black boxes.
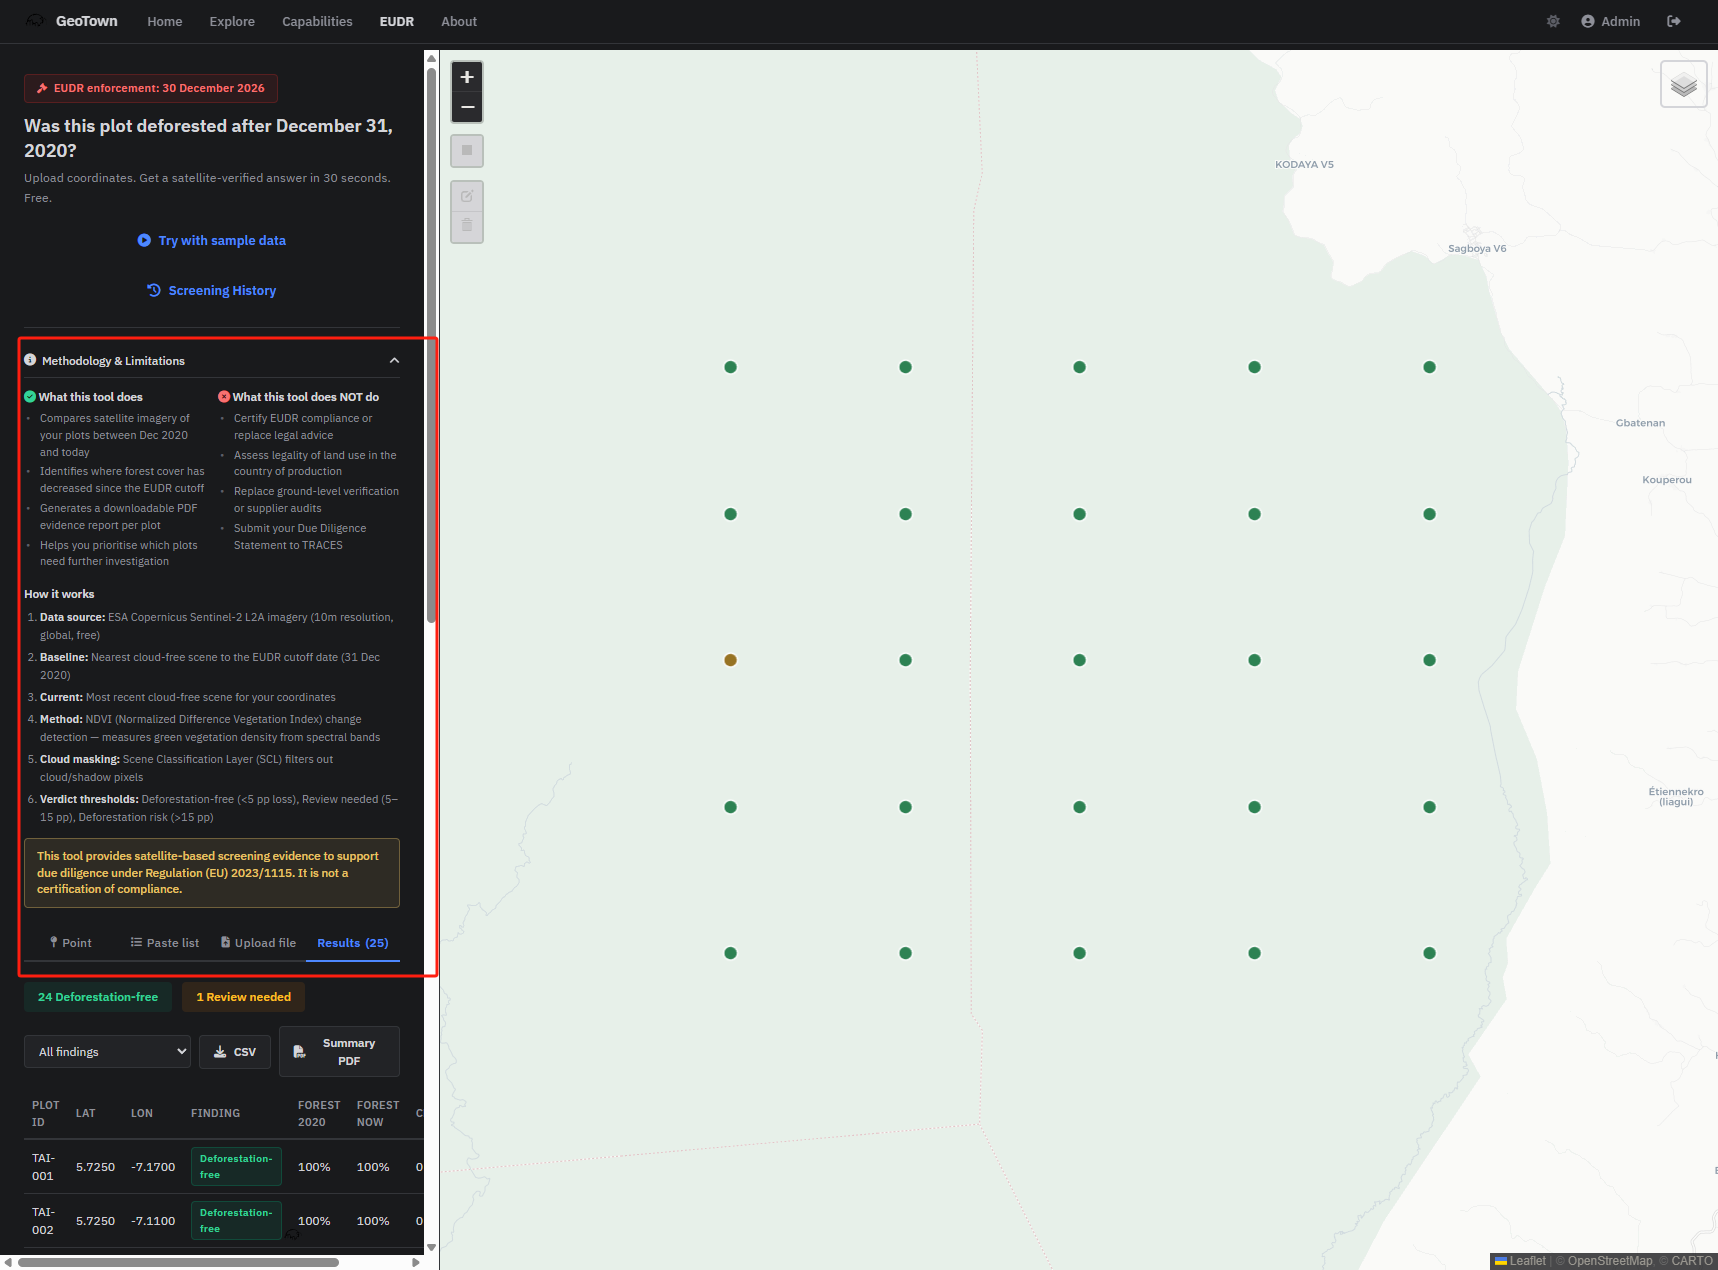 The methodology is visible on every screening. What the tool does, what it doesn't, and the exact steps: data source, baseline selection, NDVI method, cloud masking, and verdict thresholds.
The PDF reports include a full limitations section and the exact Sentinel-2 scene IDs used, so any result can be independently verified by anyone with access to the Copernicus open data archive.
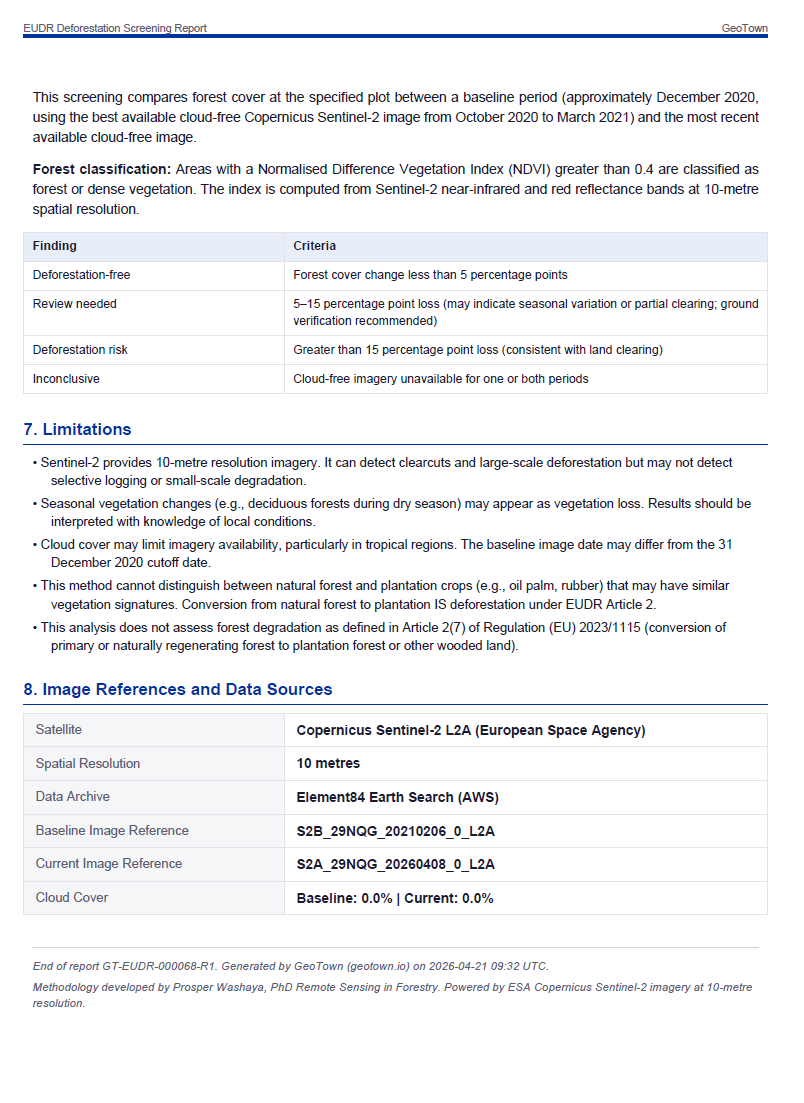 Every report includes limitations and the exact satellite scenes used — making every result independently verifiable.
Honest limitations
This is a screening tool, not a certification.
10-metre resolution. Sentinel-2 pixels are 10m x 10m. Small-scale clearing under ~0.1 hectares can be missed.
NDVI measures greenness, not land use. A drop could mean clearing, drought, disease, or harvest timing. A "review needed" verdict means "investigate further," not "this is illegal."
Cloud cover in the tropics. Finding cloud-free imagery near the exact cutoff date isn't always possible. The tool searches a window (October 2020 to February 2021) and reports which scene it actually used — as you can see in the report, the baseline scenes ranged from late 2020 to early 2021.
Complement with ground-truth. Satellite screening should always be paired with on-the-ground verification for compliance purposes. This tool is the first filter, not the last one.
What this means for cooperatives and importers
If you're a cocoa cooperative in Cote d'Ivoire with 500 member farms, you don't need to hire a remote sensing team to start your EUDR due diligence. You need a fast way to sort your plots into three buckets: clearly fine, clearly not fine, and needs a closer look.
That triage is what this tool does.
For EU importers: if your supplier hands you a list of source coordinates, you can independently verify their claims in minutes — not weeks, not after paying a six-figure compliance platform fee.
Try it yourself
GeoTown's EUDR screening is free to try. Upload coordinates, get a verdict in 30 seconds.
Screen your plots now → geotown.io/eudr
Need to screen hundreds or thousands of plots? Or want API access for bulk verification? Reach out: prosper@geotown.io